
Analysis of CFC ratings data 1995-2010
| Home | Ranking | Ranking Summary | Rating Distribution | Rating Dist. Summary | Tournaments | Player Retention | Tournament Winners |
|---|---|---|---|---|---|---|---|
| Database Errors | Result Statistics | Outstanding Performances | Summary Extremes |
This page presents a summary of data comparing the rating distribution at 2007-01 and 2010-09 obtained from using the Activity Query Page.
Reasons to look at the rating distribution include:
The method of counting activity is slightly different than used on the Ranking page. Activity is counted by the province it occured in - i.e. a player living in BC who played in Ontario is counted as Ontario activity rather than BC activity.
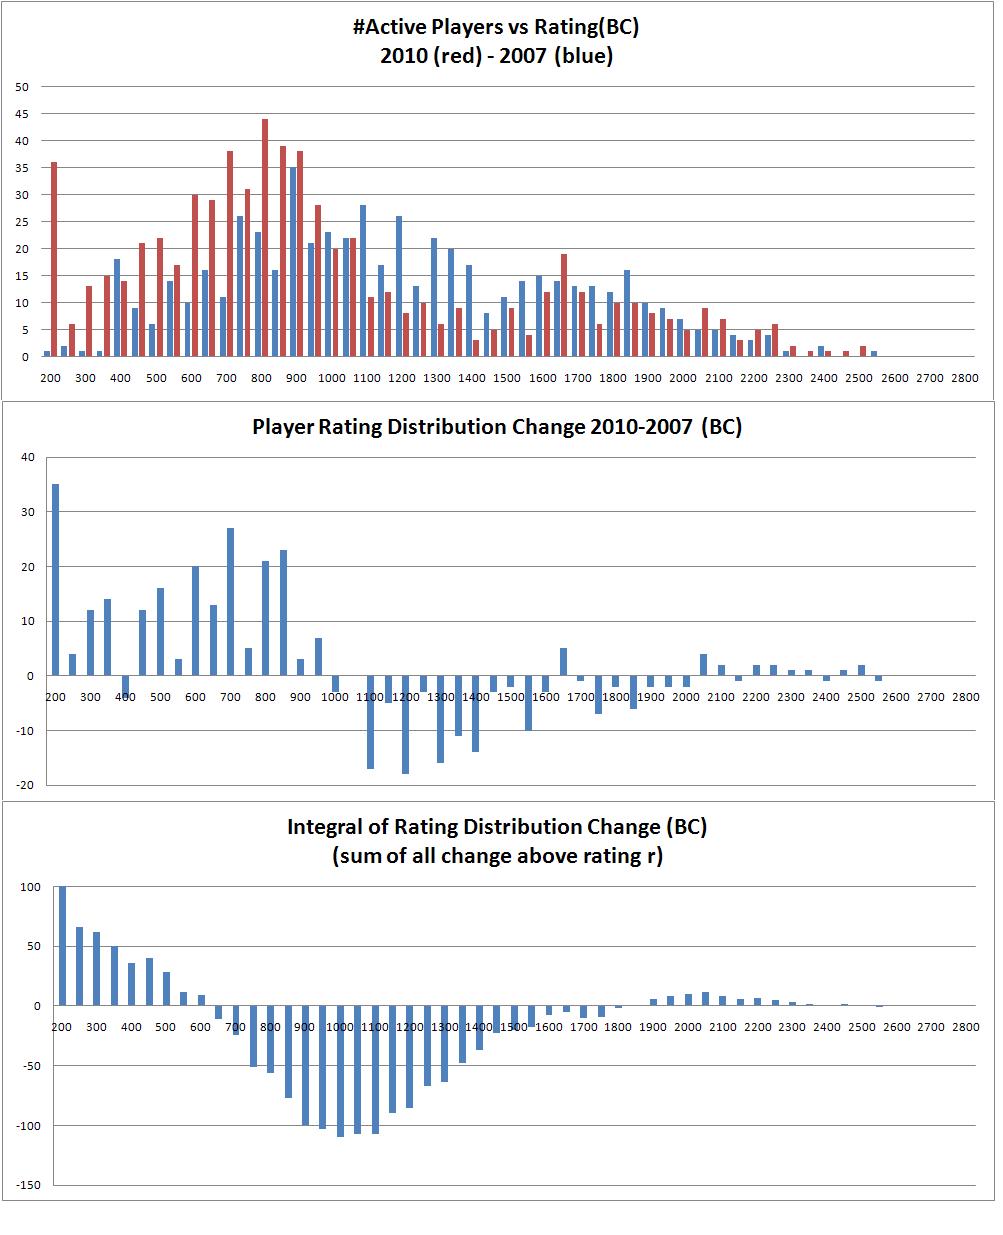
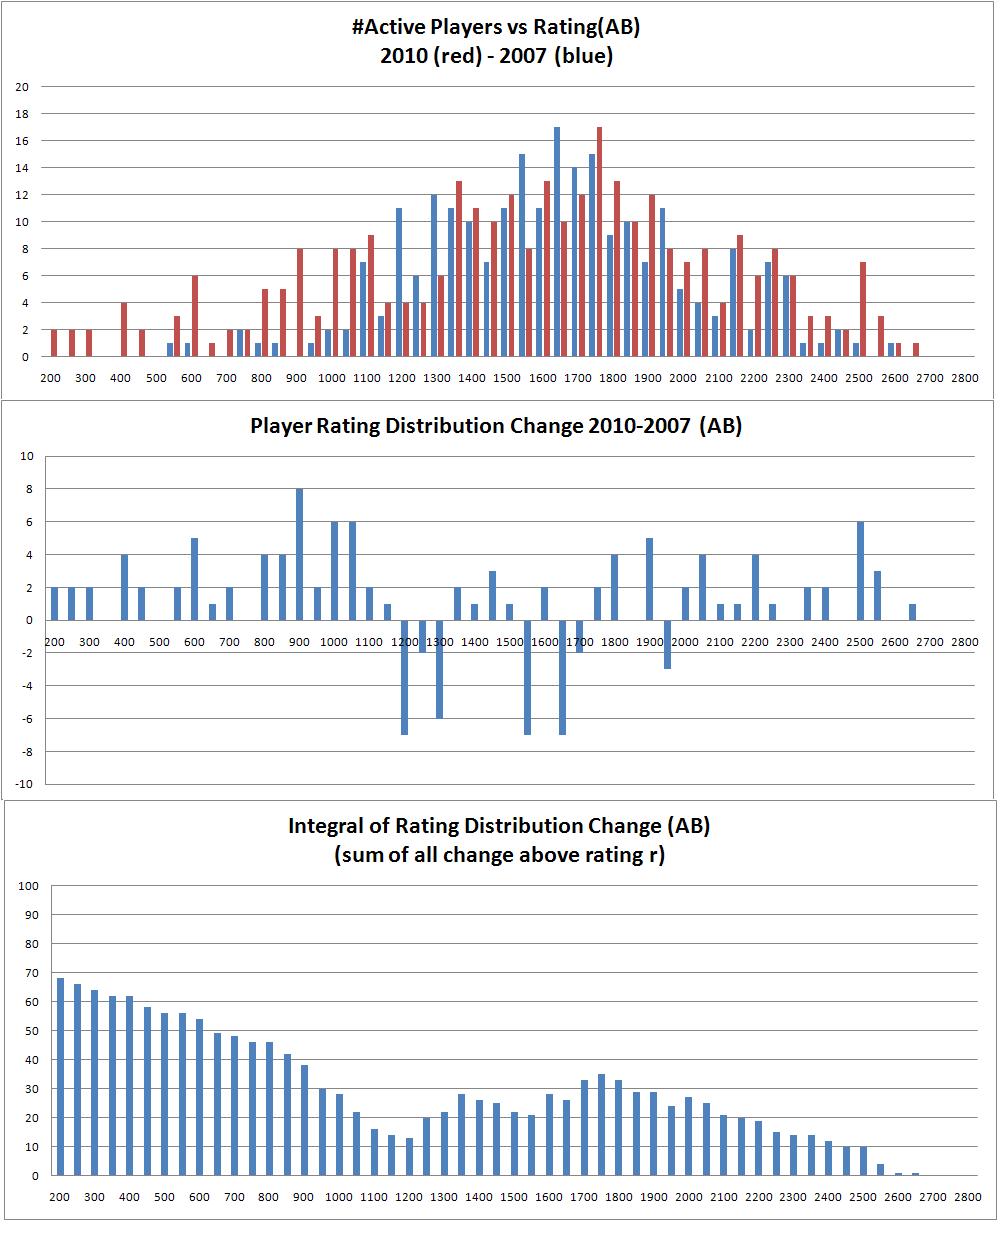
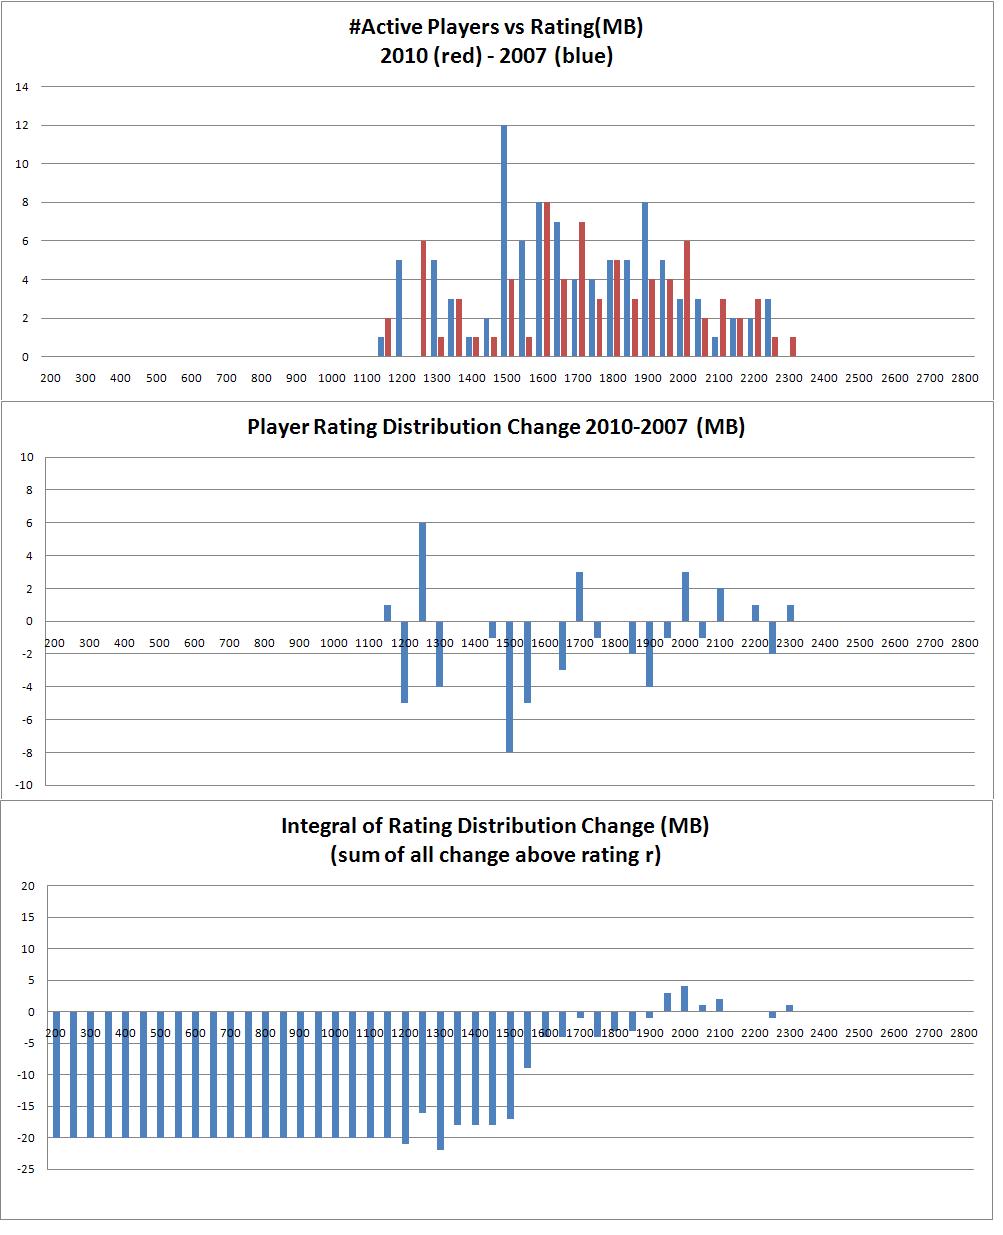
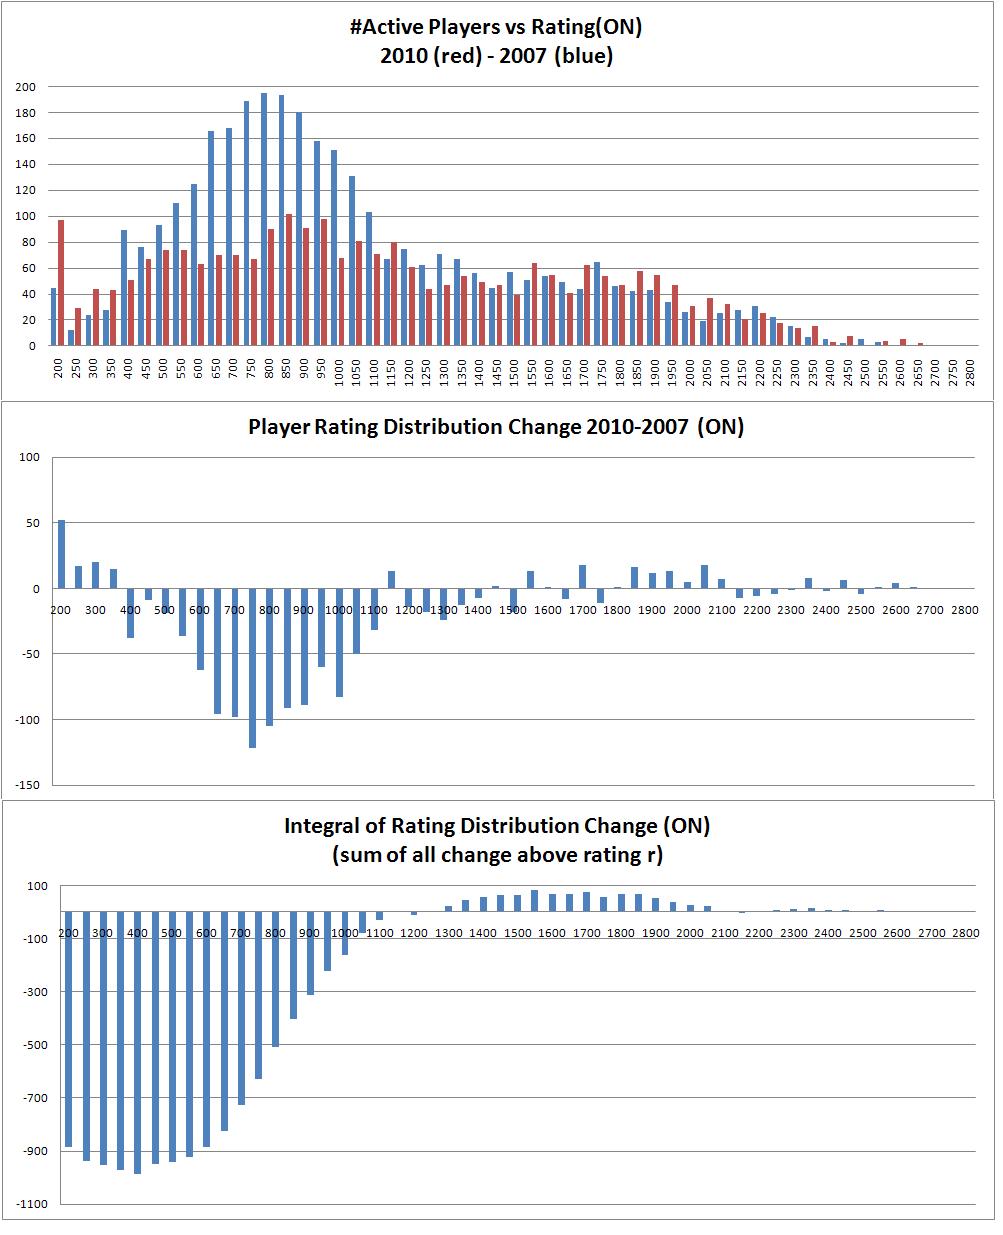
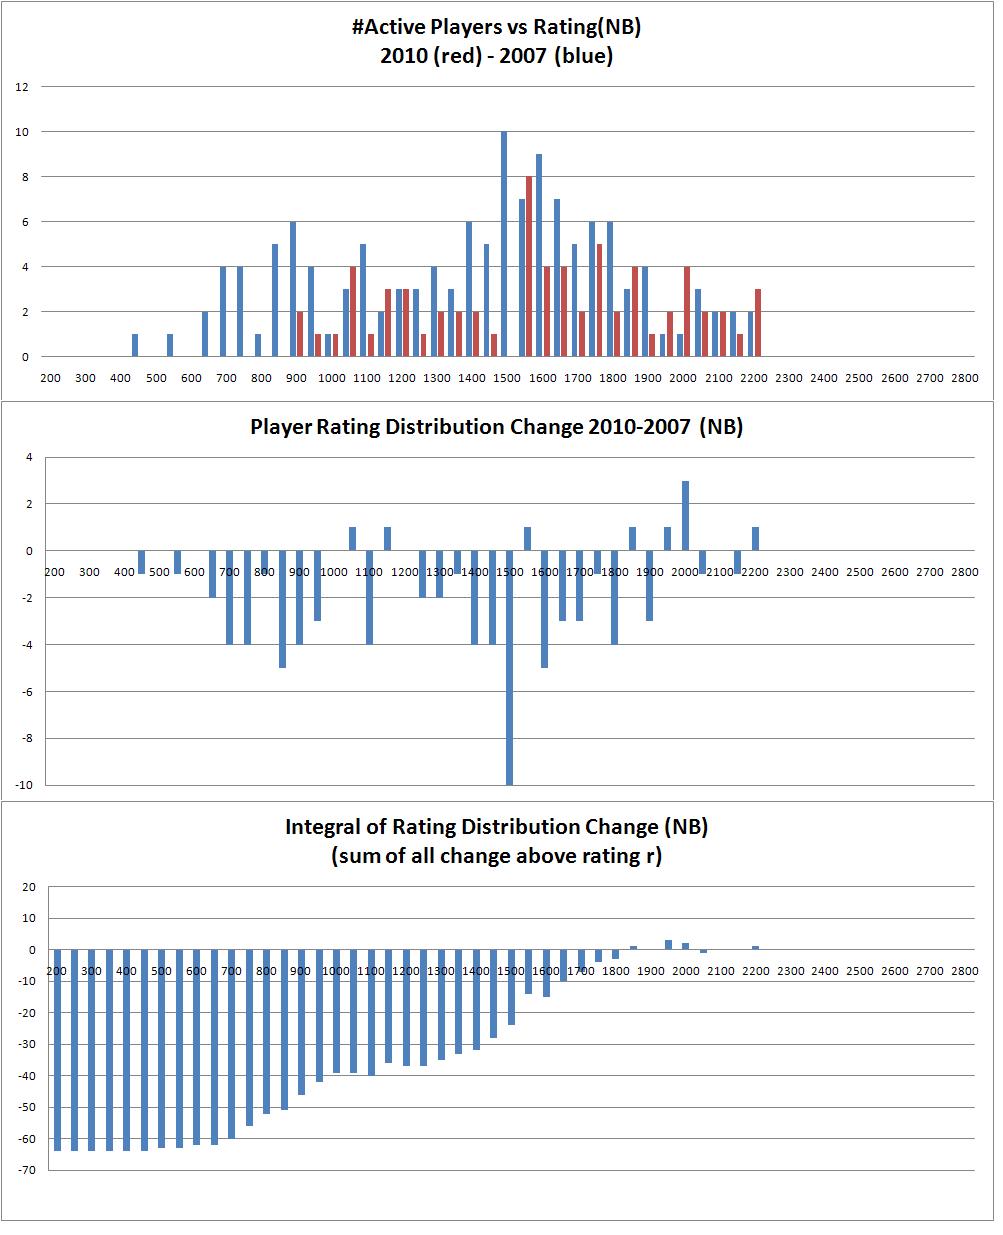
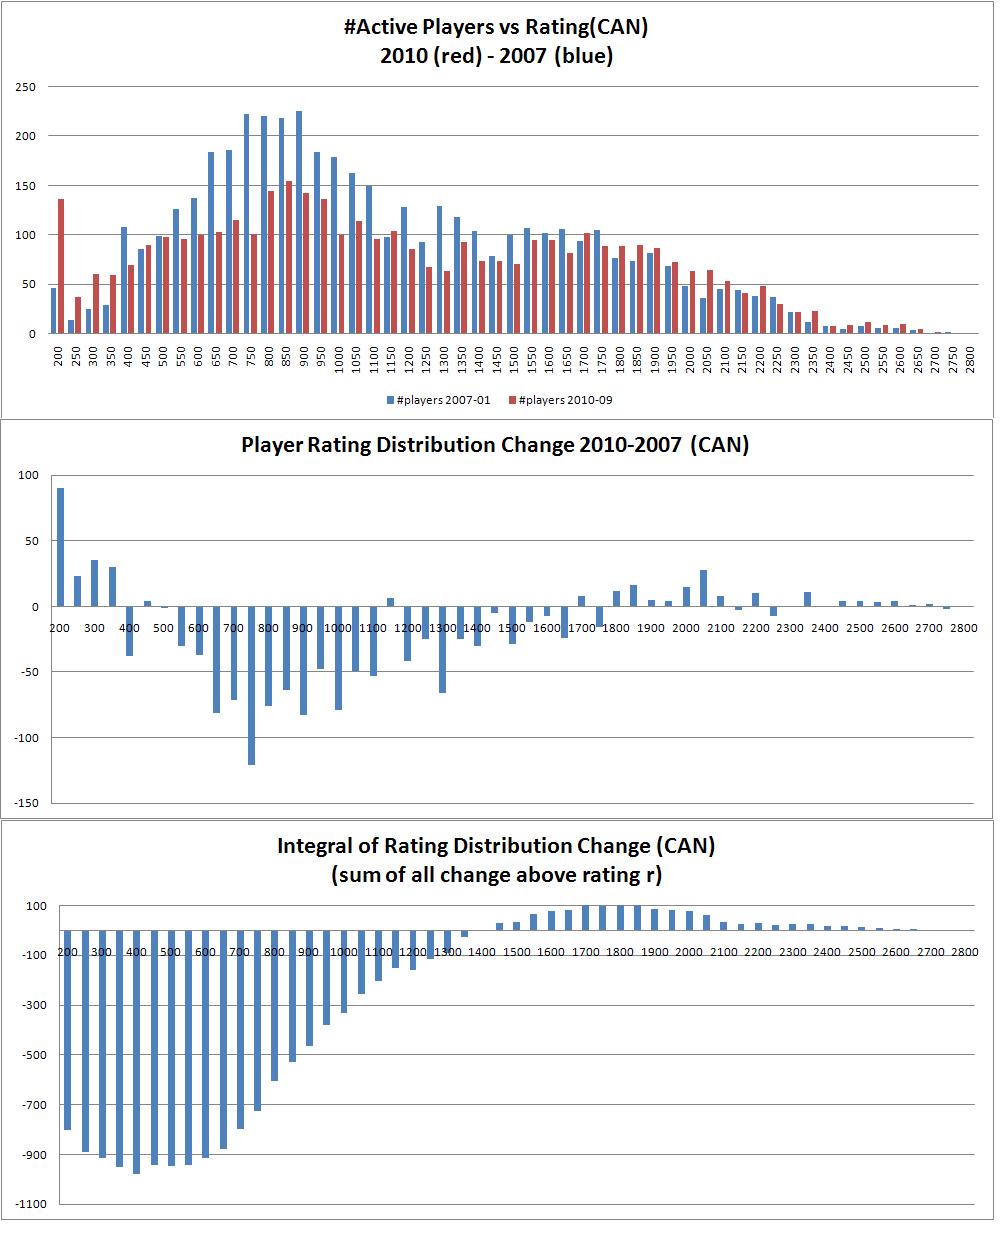
The graphs at the bottom of the page show results Canada wide for two dates, 2007 (Jan) and 2010 (Sept.) The basic distribution (graph 1) shows what looks to be a sharp decline in the sub 1200 rating population. The second graph, the subtraction of the two populations, shows this more explicitly. The negative change between the two years is largely due to the big change in the sub 1200 population although there are negative changes all the way up to ~1800 (although some of this is probably inflation related). The third graph shows the integral of the change. This is useful to show for example the total change in the population (the start of the graph or about -800 people), the change above any rating (so if you think the division between junior population and "serious" population is at 1200 then the serious population had a loss of about 150 people), and possibly as an indicator of inflation (i.e. positive values for this integral can be caused by a shift of the distribution to the right [ although it could also be an actual increase in people]).
As is well known, there is in fact two populations being rated that have minimal cross interaction: the purely junior tournaments (typically with very low ratings) and the world of "adult" serious chess (which of course includes some juniors). As the CFC database does not provide a means of separating these two, I have somewhat arbitrarily taken the dividing line as a 1200 rating. In view of this, Canada as a whole has had a very large change in the number of active juniors (whether due to loss of interest, fewer organizers, changes in CFC rating policy for junior tournaments, or movement to CMA, or other). It has had a small decrease in the adult population, (argueably none if you think the crossover point is higher than 1200), and there is some evidence to support ratings inflation between these two dates.
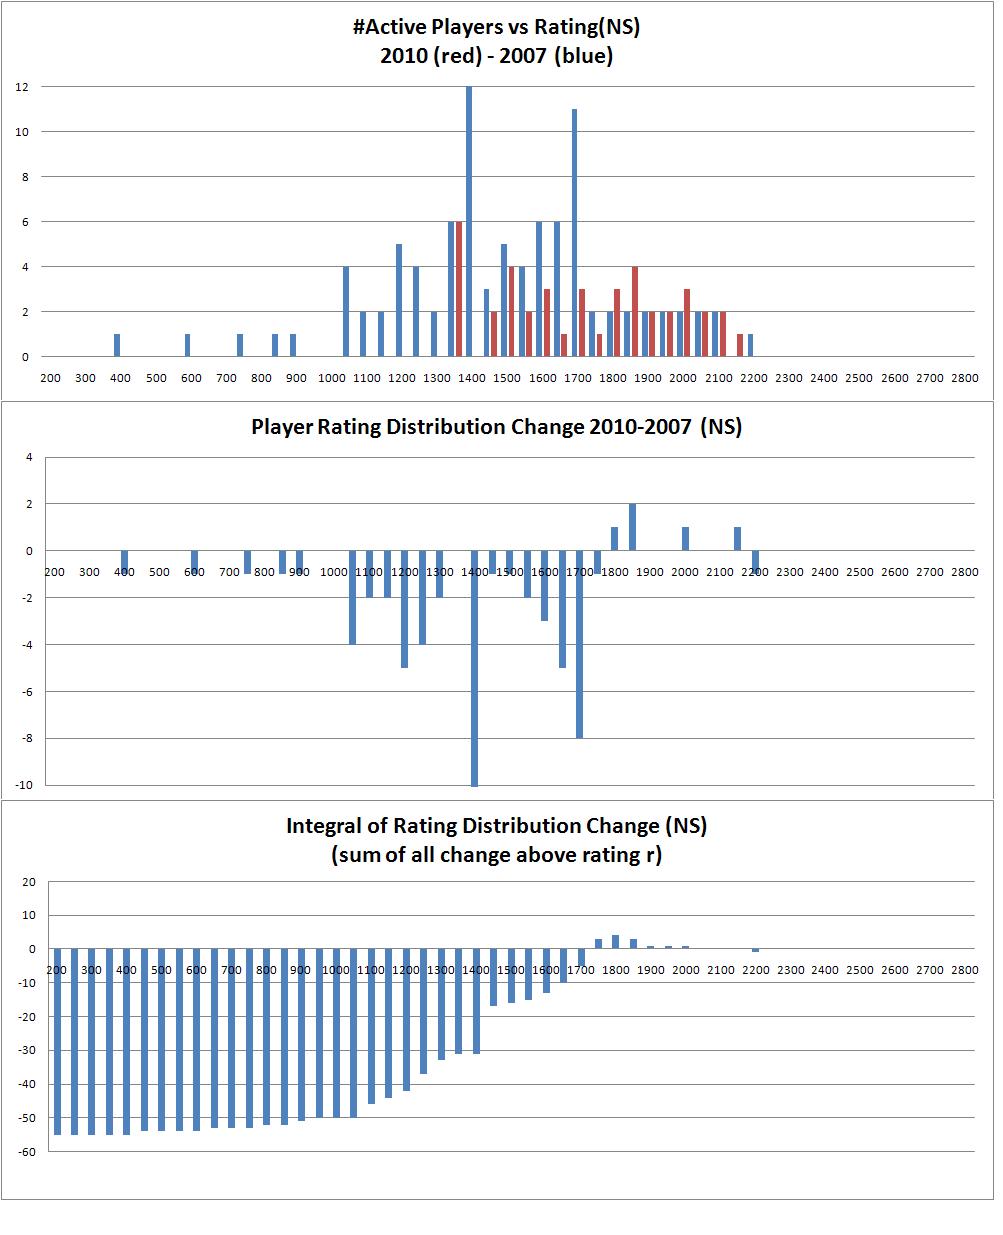
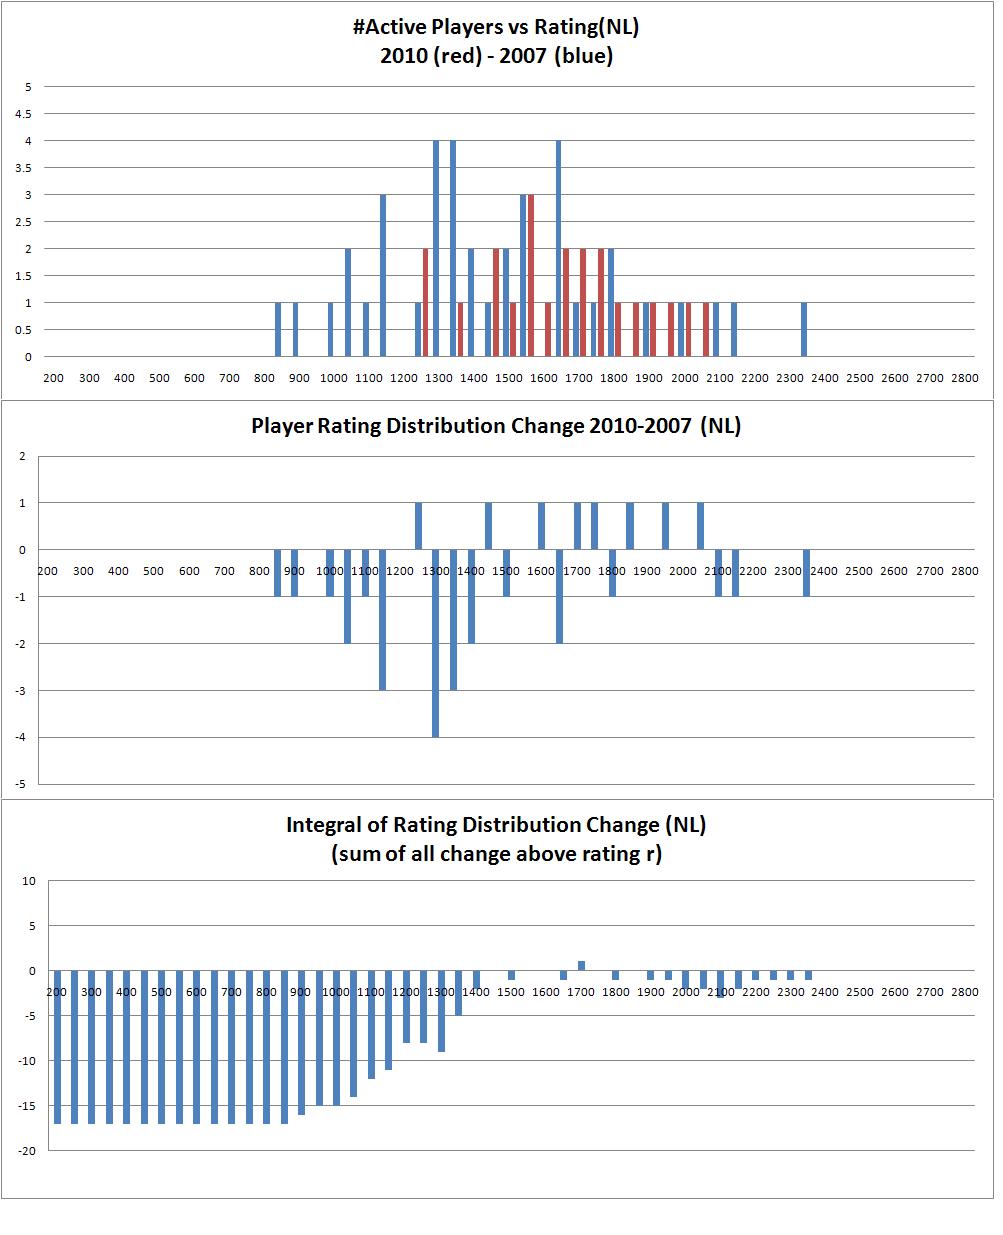
This is somewhat misleading however. Reviewing the data for the individual provinces shows that most provinces (except BC, Alberta) have large negative changes in the junior population. Most provinces (except Alberta which is up and Ontario which is flat) have large negative decreases in their adult population. And by large, I mean nearly (or even completely) catastrophic. The smaller provinces are dissappearing.
A table summarizing the relevant population changes for the provinces for 2007.01-2010.09 is given below. Distribution graphs for the individual provinces can be found at:
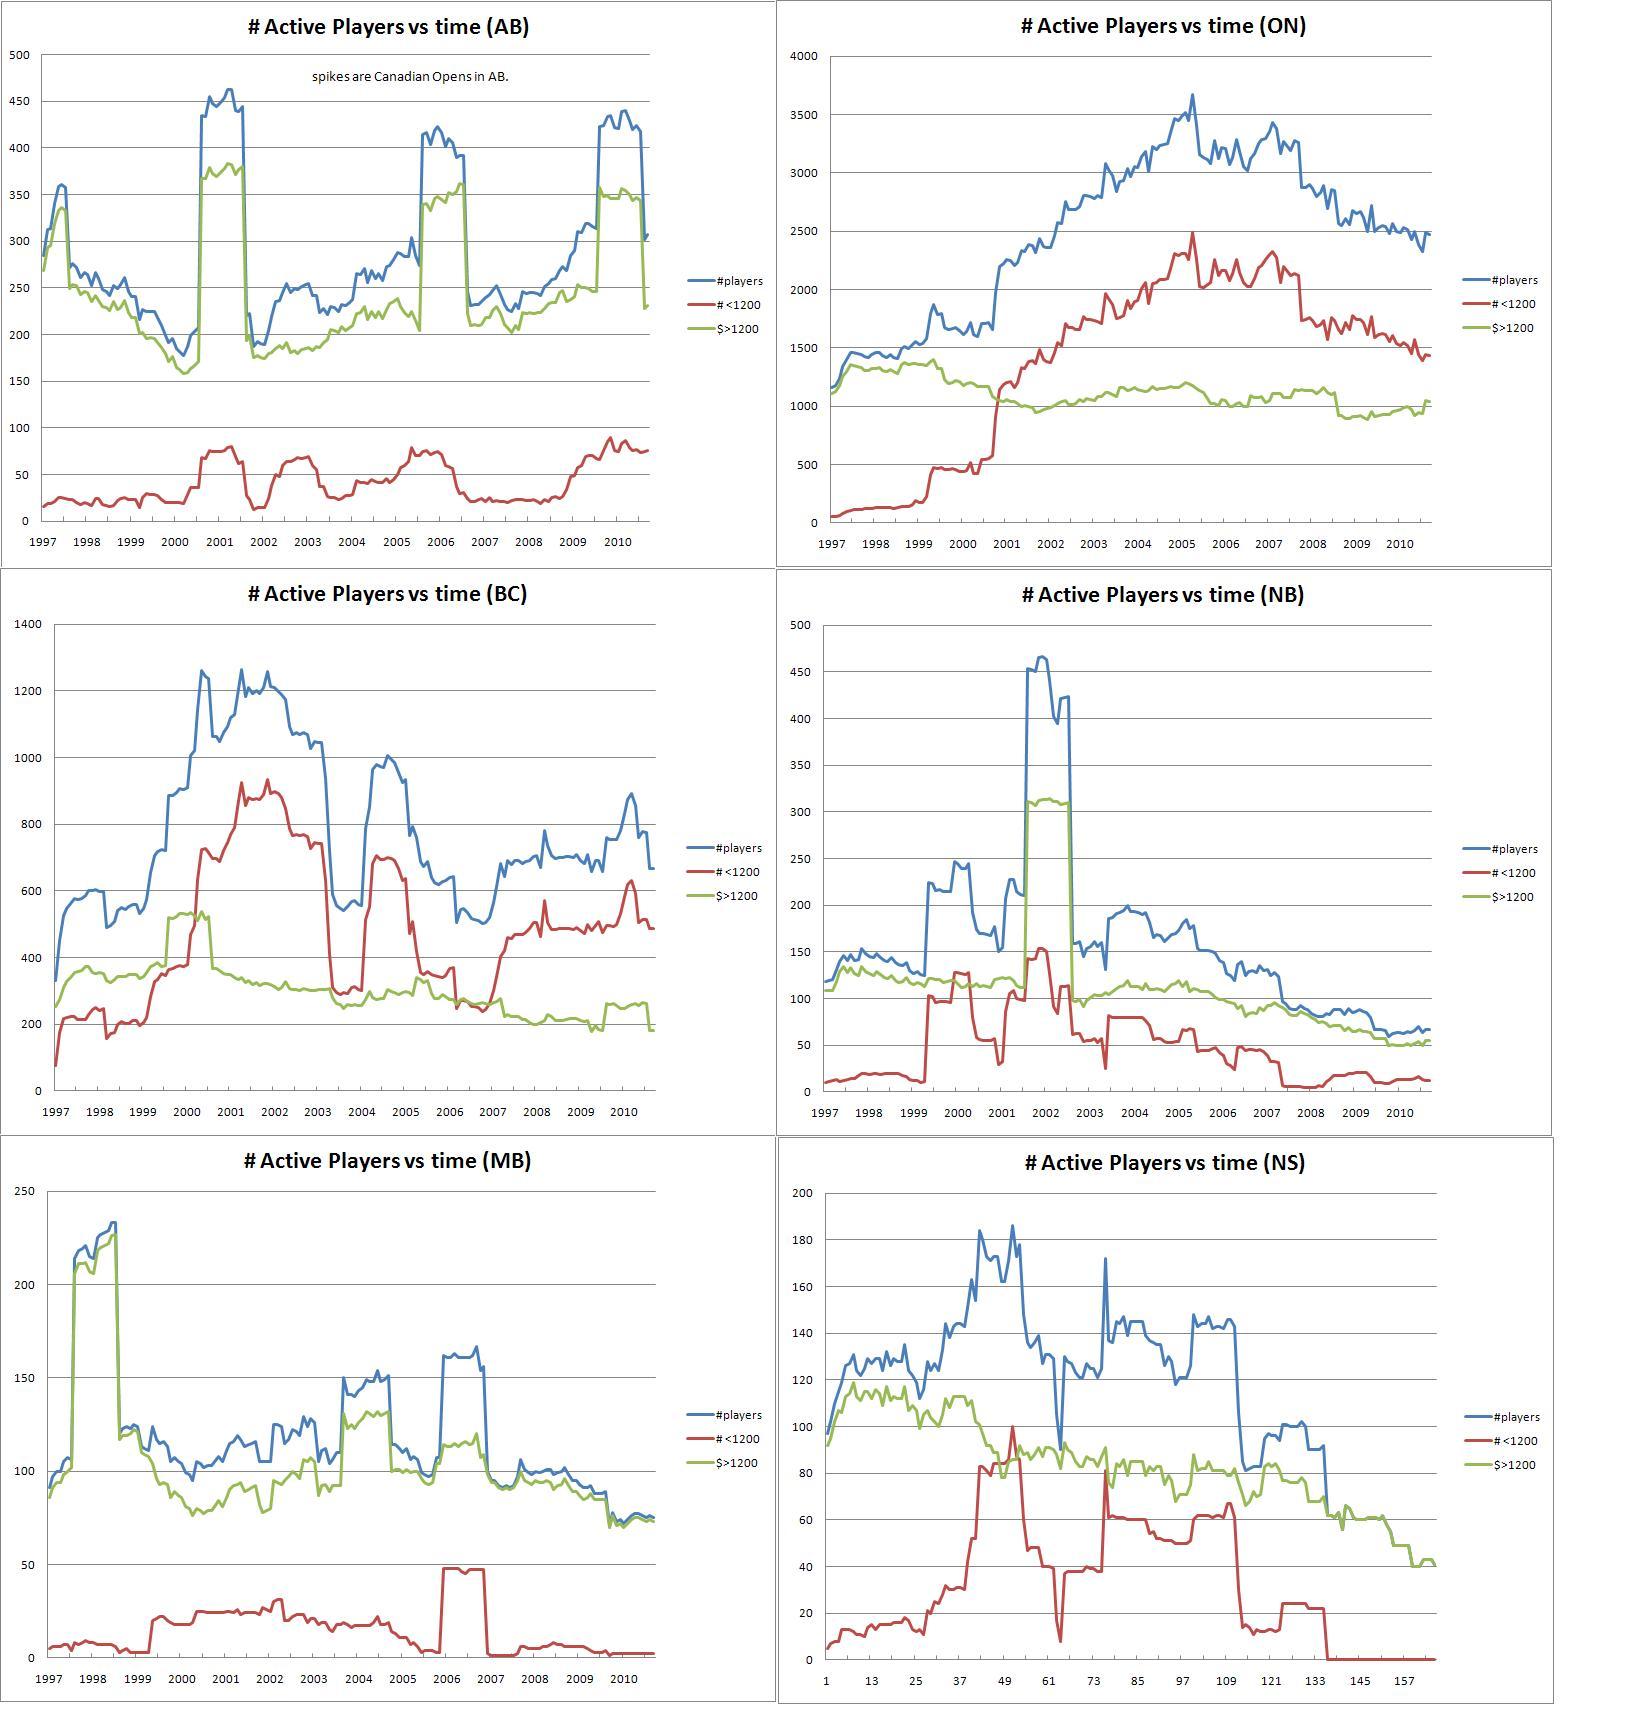
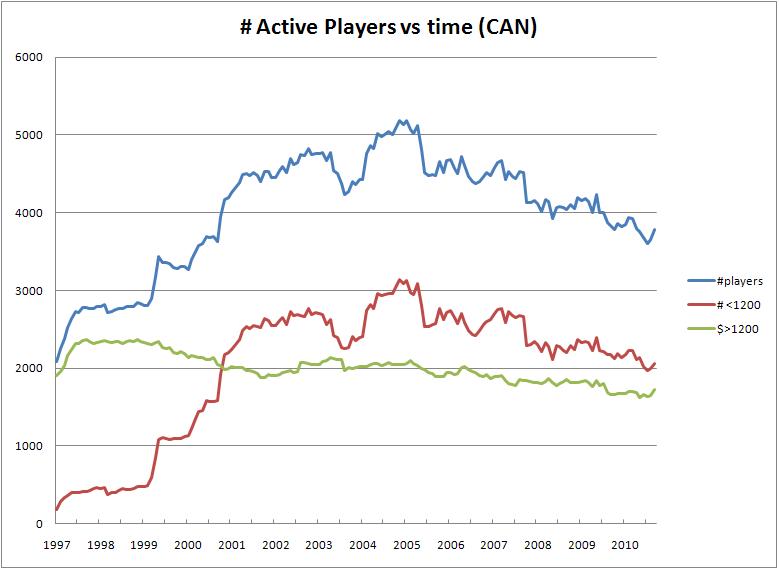
With the augmentation of the CFC data to cover back to 1996, it is possible to get data for the size of the distribution (total, <1200 (a.k.a. juniors), >1200 (a.k.a. 'serious' players)) over an extended period of time. A graph for Canada as a whole for 1997.01-2010.09 is shown below. The individual provinces can be seen at provinces
A graph of Games Player per player by rating is pretty interesting too (at the bottom). Strength and games played per year are pretty strongly correlated.
Summary of population changes between Jan. 2007 and Sept. 2010 for entire population, rating <1200, and rating >1200
| Province | #players 2007-01 | change to 2010-01 | change: % | #rated <1200 2007-01 | change <1200 | change % | #rated > 1200 2007-01 | change >1200 | change % |
| CAN | 4586 | -801 | -17% | 2698 | -643 | -24% | 1888 | -158 | -8% |
| ON | 3354 | -884 | -26% | 2303 | -873 | -38% | 1051 | -11 | -1% |
| BC | 565 | 101 | 18% | 300 | 186 | 62% | 265 | -85 | -32% |
| AB | 239 | 68 | 28% | 21 | 55 | 262% | 218 | 13 | 6% |
| MB | 95 | -20 | -21% | 1 | 1 | 100% | 94 | -21 | -22% |
| NB | 131 | -64 | -49% | 39 | -27 | -69% | 92 | -37 | -40% |
| NS | 96 | -55 | -57% | 13 | -13 | -100% | 83 | -42 | -51% |
| NL | 39 | -17 | -44% | 9 | -9 | -100% | 30 | -8 | -27% |
| SK | 49 | -49 | -100% | 8 | -8 | -100% | 41 | -41 | -100% |