Analysis of CFC ratings data 1995-2010
| Home | Ranking | Ranking Summary | Rating Distribution | Rating Dist. Summary | Tournaments | Player Retention | Tournament Winners |
|---|---|---|---|---|---|---|---|
| Database Errors | Result Statistics | Outstanding Performances | Summary Extremes |
Summary of Test Statistic Distributions
This page is a summary of test statistic distributions obtained from enquires of the data base for extreme performances
First, a few words about the test statistic used. Given a distribution of outcomes (win, loss, draw) for two players for any given rating difference, one can then calculate a standard deviation of those results or sigma as a function of (rating difference). For an extended match between those players, or indeed for any tournament result for an individual one can calculate the expected standard deviation for the tournament sequence from the standard deviations of the individual games (the total variance or sigma squared is the sum of the individual variances). Measuring the (actual standard deviation)/(expected standard deviation) will then provide a normalized test statistic which can be used to test for statistically unusual tournament performances. In the absence of strength change, this distribution should be normal. Differences from the normal distribution and/or a large test statistic might then be considered as a way to identify players whose strength has changed significantly (e.g. improving juniors) and whose rating should be adjusted over and above the usual rating formula change.
In calculating the test statistic, I have done the following:
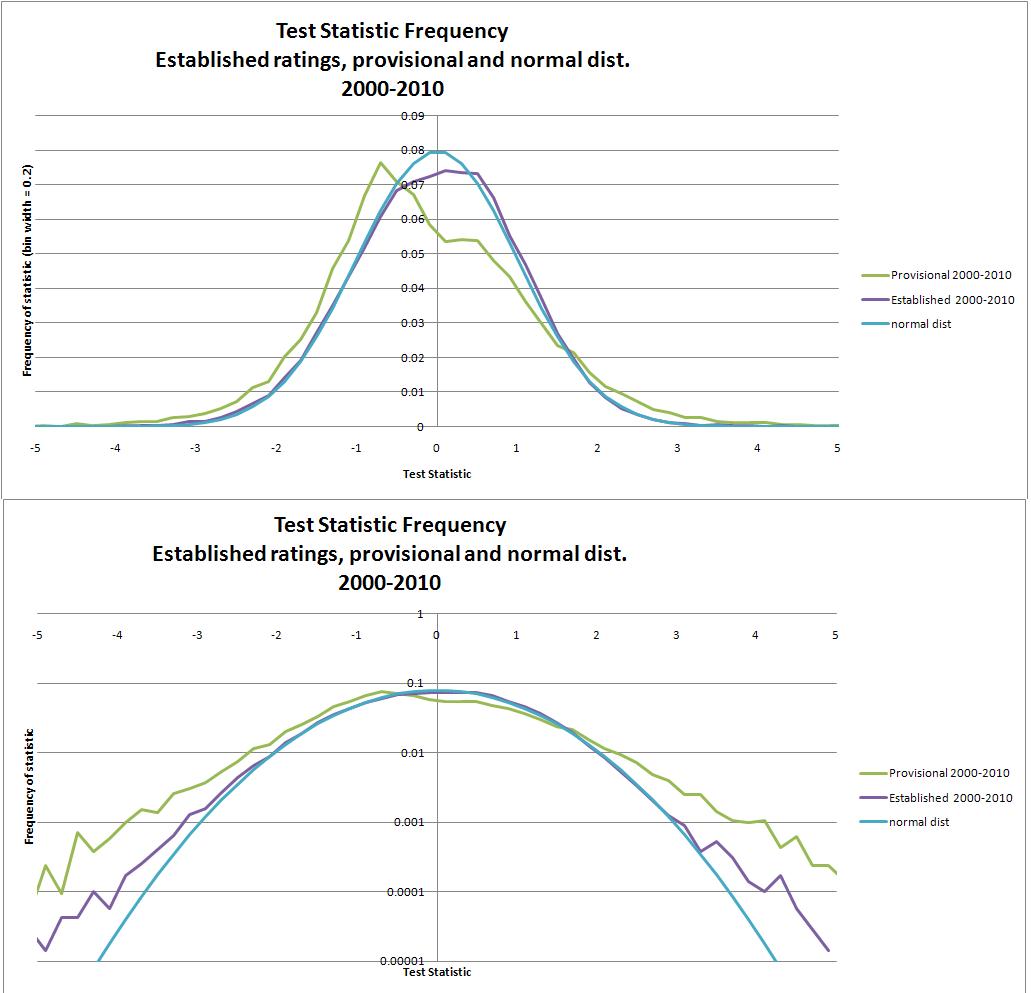
The distribution of test statistic results is plotted below for a) players with provisional ratings (20,965 data points), b) players with established ratings (70,899 data points), c) a normal distribution for the period 2000-2010. Both a regular plot and semilog plot are provided.
The general impression is that the test statistic for established ratings does follow closely a normal distribution and can likely be used to make inferences about the likelihood of a particular performance given a player's rating. Some specific observations are:
These features of the distribution occur in each of the single year data sets as well in the full data set. Given this repetitive behaviour and the large number of data points, these features should be considered significant even though some of them (e.g. the small increase in the +0.5-+1.5 sigma range for the established ratings over the normal distribution) are quite small.
One application of this statistic is to try and identify players who are outperforming their rating and who should have their rating readjusted. I was hoping that such players would show up clearly in the data. Looking at the distribution, it does not seem likely that improving individuals can be identified through the test statistic by one tournament alone - there are enough people getting good results just as a matter of chance that the improving players don't stand out. Perhaps the improving players show up as more gradual improvements - hence the excess of the statistic curve over the normal curve in the +0.5-+1.5 sigma range. But perhaps there are other measures such as people getting multiple in a row high standard deviation performances. The extreme performances page lists, for any given year, people with multiple tournament performances above 2 sigma (positive and negative). In 2010, for example, two people had 3 such results (Benjamin Blium with 3 out of 3 tournaments and Jason Cao with 3 out of 4 tournaments). This is a roughly 1/10,000 likelihood and so it seems likely that these people are underrated. A number of people had two results of +2 (or minus 2) sigma. The names I know of that group are people I consider underated. Other correlation possibilities are such performances with also being at a lifetime high in rating so this might be a separate indicator of improvement. Alternatively, perhaps it is not necessary to identify precisely the improving individuals. Increasing the K factor for high sigma performances would tend to raise the rating of people who are improving but be on average rating neutral for those who just had a good result but are not otherwise getting better.
 ;
;