Analysis of CFC ratings data 1995-2010
| Home | Ranking | Ranking Summary | Rating Distribution | Rating Dist. Summary | Tournaments | Player Retention | Tournament Winners |
|---|---|---|---|---|---|---|---|
| Database Errors | Result Statistics | Outstanding Performances | Summary Extremes |
Ranking Data Summary
As a side effect of collecting the ranking data, information is also collected on player activity. Graphs are shown below. They are not happy graphs. Interestingly, the number of player-tournaments (i.e. the sum of all players in each tournament) is roughly constant with time. However, the actual number of active players is strongly decreasing with time, sometimes catastrophically so. An entire province, Saskatchewan, has been lost to the CFC and no one has noticed. Only BC and Alberta have managed to buck the trend.
Note that the number of active players is much higher than the actual numbers of CFC members (by a factor of 2 or more) This is largely due to the presence of junior rated tournaments for which CFC membership is not required. (these are usually players with ratings below 1000). As there is a wide variability across the country as to wether junior tournaments are CFC rated or not, some further analysis of rating distribution and activity is required to understand the differences in activity between regions.
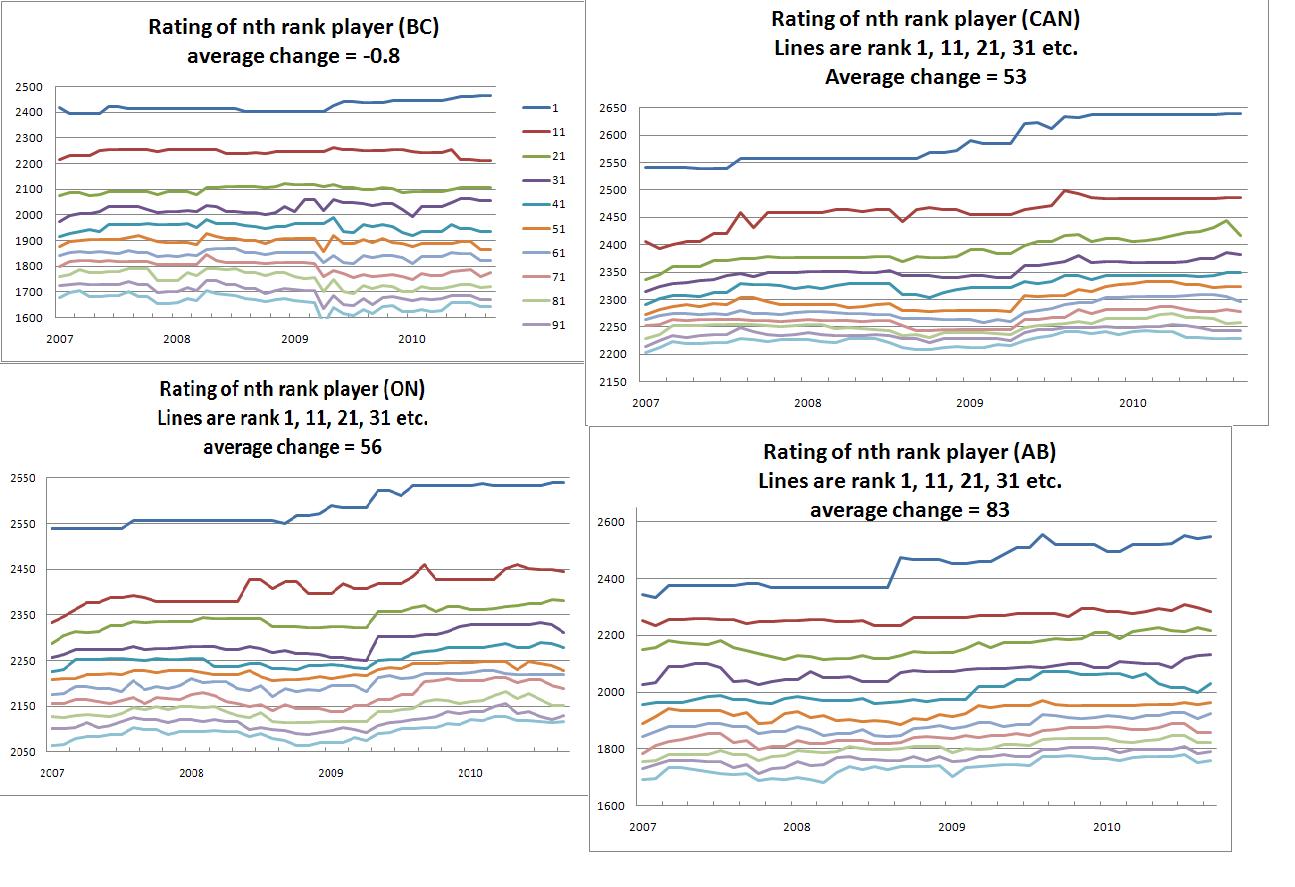
The ranking data results are shown in the graphs following the rating activity results. They show the rating of the nth ranked player (where n = 1, 11, 21, 31, etc.) as a function of time. Generally speaking, they show a rising trend although this is not true for all regions. Interpreting this as ratings inflation seems natural although other possibilities include demographic changes and changes in the number of active players. The decreasing trend for activity would tend to show up in these graphs as a decreasing trend in the ratings of the nth ranked player (in a smaller population, the nth ranked player is probably not as strong as in a larger population). Consequently, any ratings inflation, in view of the decreasing activity levels, is likely larger than the values showing in the increase of the nth ranked player. The smaller provinces have not had graphs shown as the decrease in the playing population is so large as to make conclusions about inflation questionable.
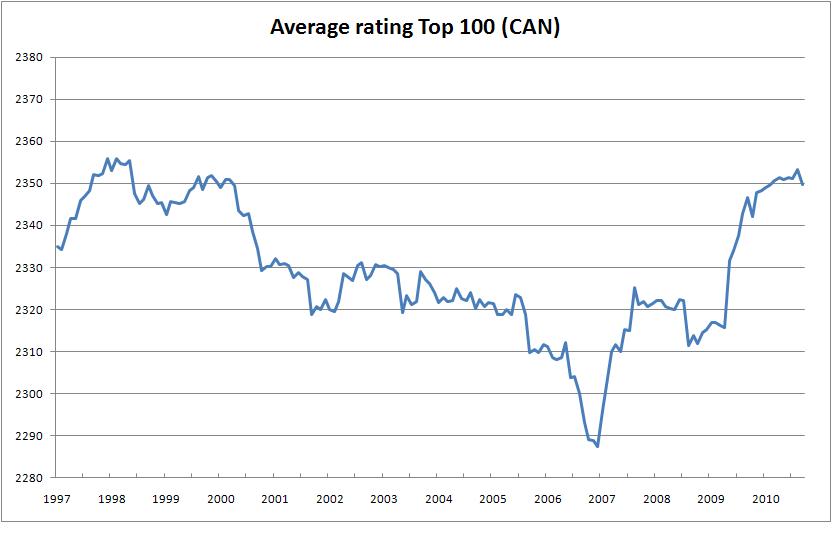
The average rating of the top 100 players is also shown for 1996-2010. The inflationary tendancies of the last few years are clearly evident as a sharp rise. There may have been some deflationary issues in the 2006 timeframe but the counter deflationary measures adopted seem to have been too strong.

 >br>
>br>